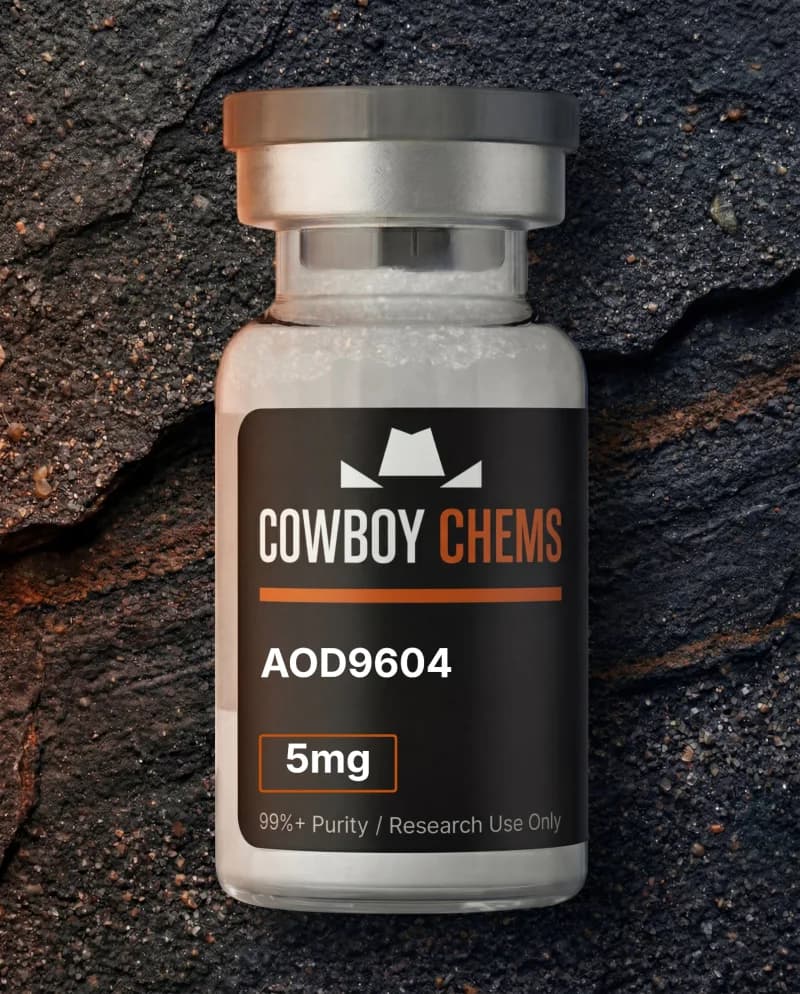
A package arrives, the indicator has tripped, and the immediate question is whether the material is still usable. The honest answer is that the indicator cannot tell you, and neither can anything else on the outside of the box. What a thermal record does is define the question well enough to answer it properly, and that is worth understanding before the decision gets made on instinct.
What the two device types actually report
Chemical indicators use irreversible color-changing reactions activated by temperature excursions, typically turning from clear to red if temperatures exceed 8°C for a defined duration. The output is binary: a threshold was crossed for at least the defined interval, or it was not.
Electronic data loggers record continuous temperature readings at set intervals, producing a detailed time-temperature profile for the entire transit window. The output is a curve, and a curve supports questions a threshold cannot.
The gap between them is the difference between knowing something happened and knowing what happened. A chemical indicator that has tripped is consistent with a brief spike just past threshold and with two days at room temperature. Those are not equivalent situations, and only the logger separates them.
Placement affects what either device is worth. A monitor only reports what the material experienced if it sat inside the insulated volume near the payload, and it is only conservative if it represented the warmest point, typically near the outer walls, rather than the coldest point beside a gel pack. When a record arrives without that context, its placement is the first thing to establish, because an unknown position makes the numbers hard to act on.
Why the average is the wrong number
The instinct with a logger file is to average it. That produces a misleading result, and the reason is chemical rather than statistical.
Degradation reactions follow Arrhenius behavior, meaning rate constants increase exponentially with temperature rather than linearly. As a working approximation across the range peptides encounter in transit, each 10°C increase roughly doubles reaction rates. Time spent hot therefore contributes disproportionately to total degradation, and an arithmetic mean weights every reading equally.
Mean kinetic temperature is the metric that handles this. It is a weighted value reflecting the disproportionate contribution of the hottest portions of an exposure, which is why a shipment that averaged 6°C is not equivalent to one that held steady at 6°C if it spent several hours at 30°C.
What MKT does not do is establish that degradation occurred. It is a screening metric, and it carries an assumption: the weighting depends on an activation energy for the degradation chemistry, and a default value is typically used rather than one measured for the compound in hand. If the real activation energy differs, or if the dominant pathway does not follow simple Arrhenius behavior across the range experienced, the MKT figure is an approximation of unknown tightness. It is a good trigger for analysis and a poor substitute for it.
Reading a logger trace
Four features of the curve carry most of the information.
Peak temperature, because the exponential relationship means the maximum contributes out of proportion to its duration.
Time above threshold, since a brief crossing and a sustained one are different exposures even at the same peak.
The shape of the excursion. A gradual rise across the transit window suggests exhausted refrigerant capacity, which is a package specification issue. A sharp spike partway through suggests a handling event, such as a period on a hot loading surface, which is a different problem with different implications for the rest of a shipment.
When it occurred. An excursion at the end of transit means less accumulated exposure at elevated temperature than the same excursion at the start.
What a given exposure implies
There are no universal thresholds here, and any specific numbers should be read as illustration rather than specification. As a rough shape of the problem, brief excursions of a few hours at moderate temperatures often produce no detectable change, while longer holds or substantially warmer conditions are where measurable purity loss tends to appear. Where the real boundary sits for a given lot depends on the sequence, the formulation and its excipients, the fill and container closure, residual moisture, and whether the material is lyophilized or in solution. Consequences of significant exposure include decreased target peptide content, increased impurity levels, aggregation causing insolubility, and altered behavior in functional assays.
These are ranges, not thresholds, and sequence composition shifts them. Peptides containing methionine, cysteine, or tryptophan are more exposed to oxidation. Sequences containing asparagine-glycine or aspartic acid-proline motifs are more exposed to deamidation and hydrolytic cleavage respectively. Stability behavior is a property of the specific sequence rather than of peptides as a class, so the same thermal history means different things for different compounds.
The decision that follows
A triggered indicator means the thermal history fell outside specification and the material carries unverified integrity. It does not establish damage, and it does not establish safety. The appropriate response is to quarantine the lot and confirm integrity analytically before use rather than assuming either outcome.
Two failure modes sit on either side of that. Discarding material because an indicator tripped throws away compound that may be fine, and it substitutes a binary signal for a measurement. Using material because it looks normal is worse, because thermally damaged peptide frequently looks physically normal, and researchers working with compromised material may spend weeks on invalid experiments before identifying the source.
The quarantine-and-verify path costs an analytical run. Both alternatives cost more.
Why this matters beyond one package
Excursions are particularly disruptive for longitudinal studies requiring consistent compound quality across multiple lots, since a single affected lot breaks comparability across the whole series. Brief temperature spikes during summer transit are a recognized source of batch-to-batch variability in biological assays, and the kind that surfaces only after datasets stop agreeing.
That is the practical case for keeping thermal records rather than reading and discarding them. When a dataset later shows unexplained variability, the transit record for each lot is one of the few pieces of evidence that can distinguish a compound-quality explanation from an experimental one.
FAQ
Does a tripped indicator mean the material is ruined?
No. It means the thermal history fell outside specification and integrity is unverified. The correct response is quarantine and analytical confirmation, since the indicator establishes neither damage nor its absence.
Why is mean kinetic temperature used instead of an average?
Because degradation rates rise steeply with temperature, so hot intervals contribute disproportionately, and an arithmetic mean weights all readings equally. Mean kinetic temperature applies a weighting that reflects that. It is still a screening figure rather than evidence of degradation, since the weighting assumes an activation energy that is usually a default rather than a measured value for the compound.
What can a chemical indicator not tell you?
Duration, peak temperature, and timing. It reports only that a threshold was crossed for at least a defined interval. A brief spike and a prolonged warm exposure produce the same color change.
How much excursion is too much?
There is no general answer, and a supplier quoting a universal threshold is overstating what is knowable without product-specific stability data. Brief moderate excursions often produce no detectable change and longer or warmer ones tend to, but the boundary is set by the sequence, the formulation, residual moisture, the container closure, and the physical state of the material. Sequences carrying oxidation-prone or hydrolysis-prone residues shift it further.
Should the logger file be kept after the material passes?
Yes. Transit records for each lot are what allow later dataset variability to be traced to compound handling rather than left unexplained, particularly in studies spanning multiple lots.
Research Use Only: All compounds sold by Cowboy Chems are intended exclusively for laboratory research. Not for human use. These products are not drugs, supplements, or food. Statements have not been evaluated by the FDA. Must be 21+ to purchase.
Stay in the loop
New compounds, research updates & exclusive subscriber deals.